

Building a slide deck or a report for a client, an investor or for internal use is part of a data analyst’s duties. Sometimes some of these documents are generated recurringly like Quarterly Business Reviews for example. QBRs are generated every quarter to evaluate the business internally or to demonstrate performance to business partners. Instead of building one deck per client and adjusting each value by rewriting the query with a different client id, we can simply automate the slide deck creation by having variables in a Python script to which we feed a slide deck template and a client id. This is one potential use case of leveraging Python to build fully automated processes that are streamlined and time-efficient.
The ‘S&P500 Biggest Movers’ use case:
Step 1: Build Slide Deck Template.
In this case, we are building a slide that shows us the biggest movers of the last trading day with the stock, variation, and latest news article that might give extra context on that move.
Starting with building the template is important because this is how you know what pieces of data you need to collect in order to build your slide deck.
Here is the template we are using for this case:
Step 2: Extract Data.
There is a library on Python, yfinance, that connects to Yahoo Finance and accesses data on the stock market: historical stock prices, news articles, financials, etc. In this case, we are leveraging this library to obtain the most recent trading day’s data:
Biggest Movers: the stocks that have recorded the largest gain and loss on that day.
The open and close stock prices to compute the percentage variation.
The latest news article that might give more context: headline + image + source.
Step 3: Automate Slide Deck Creation.
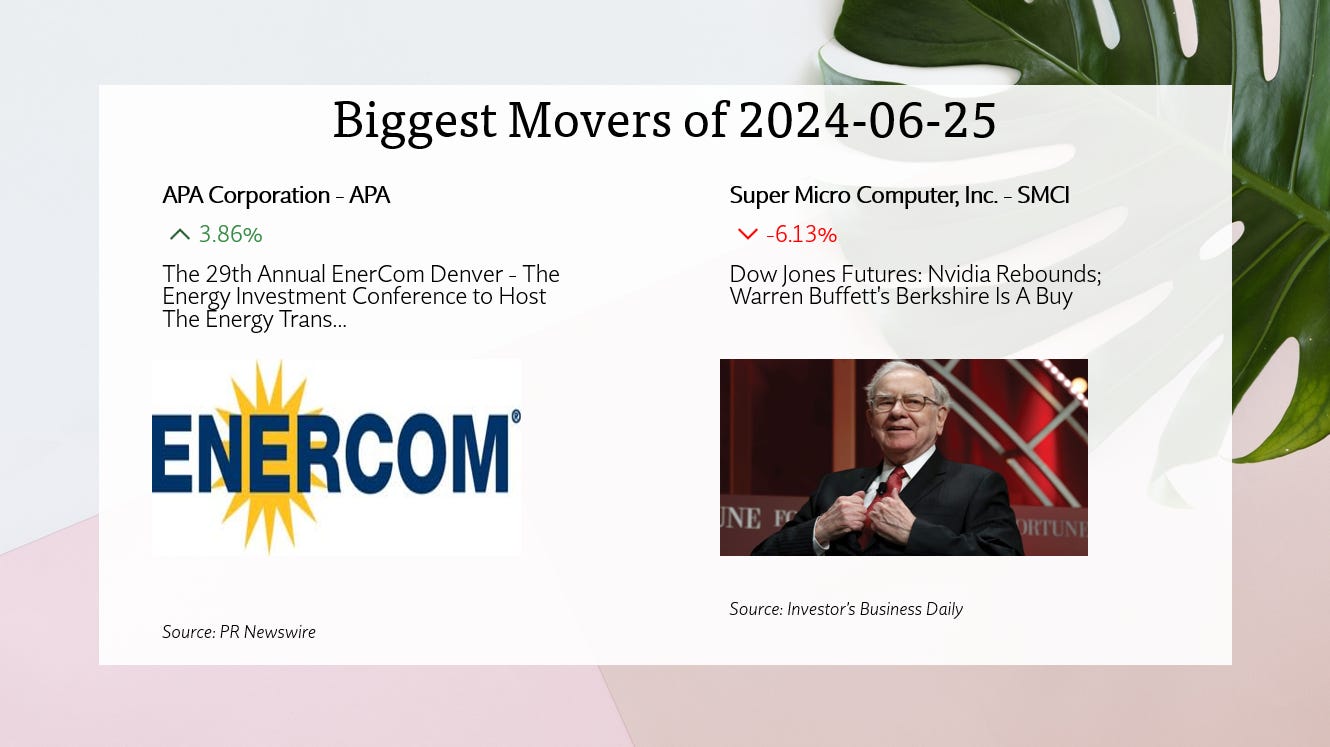
Now that we have the template and the data, all we need to do is to write the information on the deck and save it under a different name. This can easily be done with the pptx library on Python (pptx documentation). The idea here is basically to point to the {variable} placeholders on the slide and to replace them with the data that has been extracted from yfinance. As for the images, you would need to name them on the selection pane on PowerPoint in order to be able to point to them in your script.
Output:
This is a very simplistic example but can be used as a base for a multitude of use cases, automating slide deck creation for regular reporting needs. This can also be coupled with:
A self service menu: creating a simple webapp with a form will give the freedom to your team to build custom reports based on specific needs, inputting a custom date range, client id, or other types of filters.
A task scheduler: using a local or cloud-based task scheduler allows you to recurringly create and/or send these reports automatically to the desired audience.
Link to Github Repository: https://github.com/younesrifai/Report-Automation